

How To Create A Candlestick Chart In Excel
How to create Stock chart in Excel
Stock charts, as the name indicates, are useful to show fluctuations in stock prices. However, these charts are useful to show fluctuations in other data also, such as daily rainfall or annual temperatures
Note: For creating Stock chart in Excel, the data needs to be in a specific order.
A Stock chart has the following sub-types −
- High-Low-Close
- Open-High-Low-Close
- Volume-High-Low-Close
- Volume-Open-High-Low-Close
Stock chart in Excel: 1. High-Low-Close chart:
The High-Low-Close Stock chart in excel is often used to illustrate the stock prices. It requires three series of values in the following order- High, Low, and then Close.
Data used for creation of this stock chart is shown below
| Date | High | Low | Close |
|---|---|---|---|
| 8-Feb-17 | 132.22 | 131.22 | 132.04 |
| 7-Feb-17 | 132.09 | 130.45 | 131.53 |
| 6-Feb-17 | 130.5 | 128.9 | 130.29 |
| 5-Feb-17 | 138 | 135 | 135 |
| 4-Feb-17 | 136 | 133 | 134 |
| 3-Feb-17 | 129.19 | 128.16 | 129.08 |
| 2-Feb-17 | 129.39 | 127.78 | 128.53 |
| 1-Feb-17 | 130.49 | 127.01 | 128.75 |
| 31-Jan-17 | 121.39 | 120.62 | 121.35 |
| 30-Jan-17 | 121.63 | 120.66 | 121.63 |
| 29-Jan-17 | 118 | 115 | 115 |
| 28-Jan-17 | 116 | 113 | 114 |
| 27-Jan-17 | 122.35 | 121.6 | 121.95 |
| 26-Jan-17 | 122.44 | 121.6 | 121.94 |
| 25-Jan-17 | 122.1 | 120.28 | 121.88 |
| 24-Jan-17 | 120.1 | 119.5 | 119.97 |
| 23-Jan-17 | 120.81 | 119.77 | 120.08 |
| 22-Jan-17 | 117 | 114 | 114 |
| 21-Jan-17 | 111 | 113 | 112 |
| 20-Jan-17 | 120.45 | 119.73 | 120 |
| 19-Jan-17 | 120.09 | 119.37 | 119.78 |
| 18-Jan-17 | 120.5 | 119.71 | 119.99 |
| 17-Jan-17 | 120.24 | 118.22 | 120 |
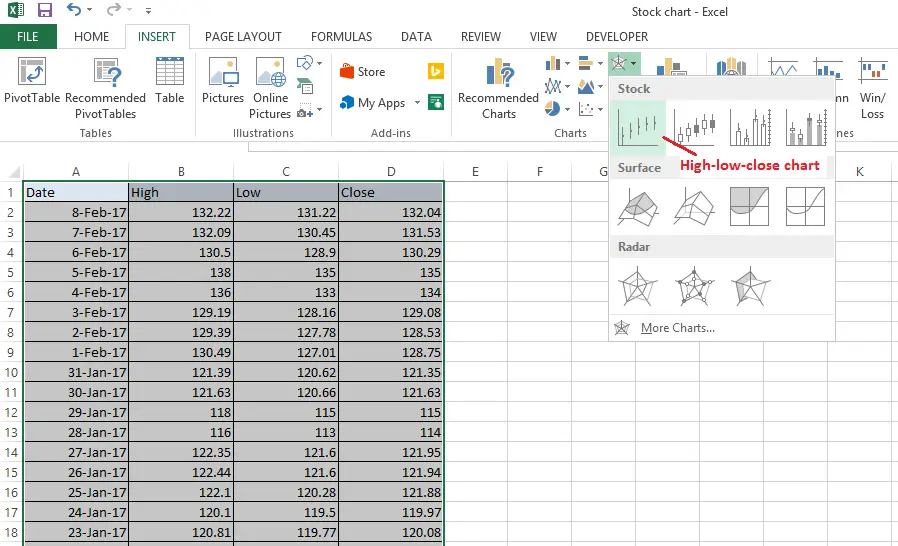
To create this Stock chart, you need to arrange the data on your sheet in order of High price, Low price and Closing price.
Then select the data On theINSERT tab, in the Charts group, click the Stock, Surface or Radar chart icon on the Ribbon. In that select the first stock chart (which is High-low-close-chart) as shown below
The resultant chart will be

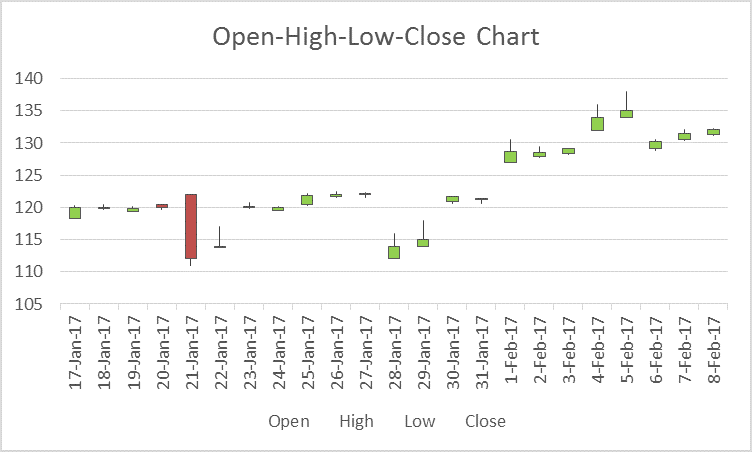
Stock chart in Excel: 2. Open-High-Low-Close Chart:
The Open-High-Low-Close Stock chart is often used to illustrate the stock prices. It is also known as candle stick chart. It requires Four series of values in the following order- Open, High, Low, and then Close.
Data used for creation of this stock chart in excel is shown below
| Date | Open | High | Low | Close |
|---|---|---|---|---|
| 8-Feb-17 | 131.35 | 132.22 | 131.22 | 132.04 |
| 7-Feb-17 | 130.54 | 132.09 | 130.45 | 131.53 |
| 6-Feb-17 | 129.13 | 130.5 | 128.9 | 130.29 |
| 5-Feb-17 | 134 | 138 | 135 | 135 |
| 4-Feb-17 | 132 | 136 | 133 | 134 |
| 3-Feb-17 | 128.31 | 129.19 | 128.16 | 129.08 |
| 2-Feb-17 | 127.98 | 129.39 | 127.78 | 128.53 |
| 1-Feb-17 | 127.03 | 130.49 | 127.01 | 128.75 |
| 31-Jan-17 | 121.15 | 121.39 | 120.62 | 121.35 |
| 30-Jan-17 | 120.93 | 121.63 | 120.66 | 121.63 |
| 29-Jan-17 | 114 | 118 | 115 | 115 |
| 28-Jan-17 | 112 | 116 | 113 | 114 |
| 27-Jan-17 | 122.14 | 122.35 | 121.6 | 121.95 |
| 26-Jan-17 | 121.67 | 122.44 | 121.6 | 121.94 |
| 25-Jan-17 | 120.42 | 122.1 | 120.28 | 121.88 |
| 24-Jan-17 | 119.55 | 120.1 | 119.5 | 119.97 |
| 23-Jan-17 | 120 | 120.81 | 119.77 | 120.08 |
| 22-Jan-17 | 114 | 117 | 114 | 114 |
| 21-Jan-17 | 122 | 111 | 113 | 112 |
| 20-Jan-17 | 120.45 | 120.45 | 119.73 | 120 |
| 19-Jan-17 | 119.4 | 120.09 | 119.37 | 119.78 |
| 18-Jan-17 | 120 | 120.5 | 119.71 | 119.99 |
| 17-Jan-17 | 118.34 | 120.24 | 118.22 | 120 |
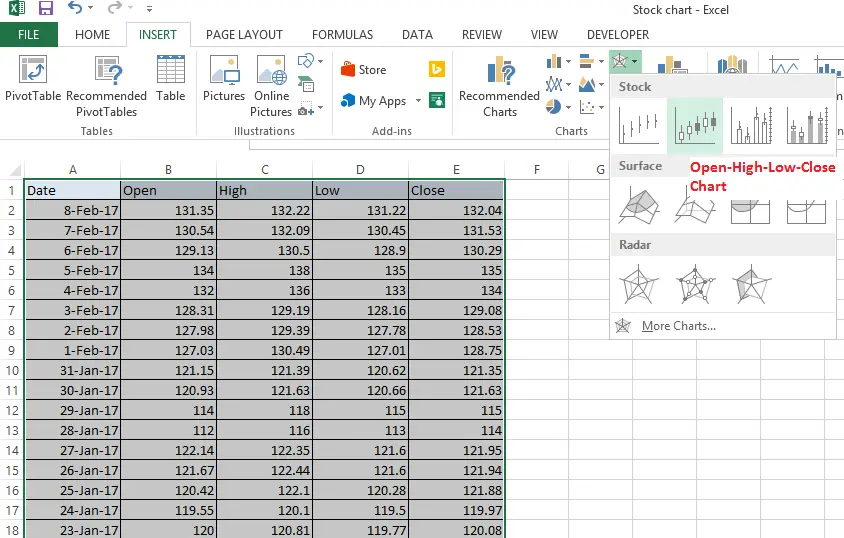
To create this candle stick chart, you need to arrange the data on your sheet in order of Open Price, High price, Low price and Closing price.
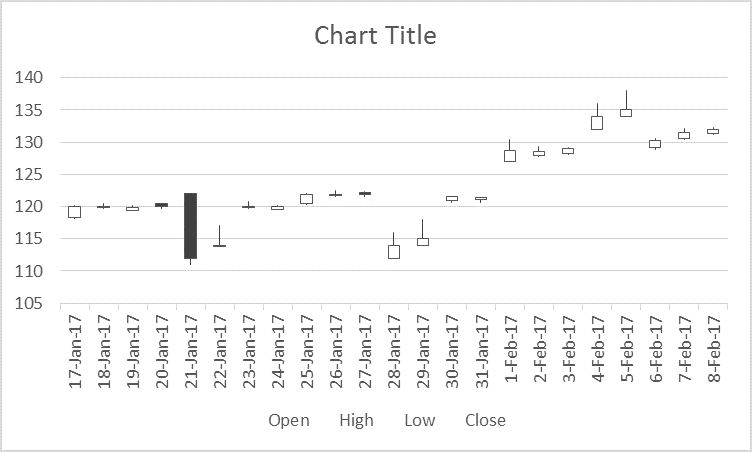
Then select the data On theINSERT tab, in the Charts group, click the Stock, Surface or Radar chart icon on the Ribbon. In that select the second stock chart (which is Open-High-low-close-chart or Candle Stick chart) as shown below
The resultant chart will be in black and white as shown
In order to add color, right click on any of the white candle sticks and fill it with Green color as shown below
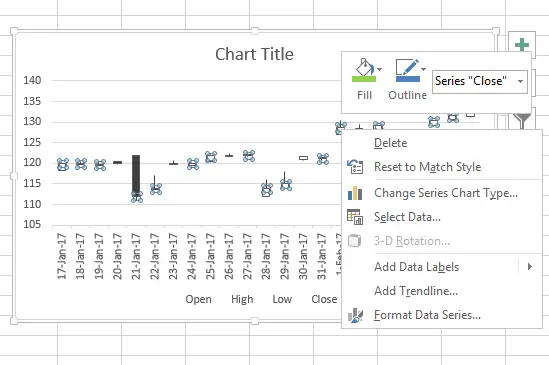
Similarly right click on any of the black candle sticks and fill it with Maroon color.so the final candle stick chart will look like
Stock chart in Excel: 3. Volume-High-Low-Close Chart:
The Volume-High-Low-Close Stock chart is often used to illustrate the stock prices along with the volume traded. It requires four series of values in the following order- Volume, High, Low, and then Close.
Data used for creation of this stock chart in excel is shown below
| Date | Volume | High | Low | Close |
|---|---|---|---|---|
| 8-Feb-17 | 23,004,072 | 132.22 | 131.22 | 132.04 |
| 7-Feb-17 | 38,183,841 | 132.09 | 130.45 | 131.53 |
| 6-Feb-17 | 26,845,924 | 130.5 | 128.9 | 130.29 |
| 5-Feb-17 | 48,183,841 | 138 | 135 | 135 |
| 4-Feb-17 | 42,183,841 | 136 | 133 | 134 |
| 3-Feb-17 | 24,507,301 | 129.19 | 128.16 | 129.08 |
| 2-Feb-17 | 33,710,411 | 129.39 | 127.78 | 128.53 |
| 1-Feb-17 | 111,985,040 | 130.49 | 127.01 | 128.75 |
| 31-Jan-17 | 49,200,993 | 121.39 | 120.62 | 121.35 |
| 30-Jan-17 | 30,377,503 | 121.63 | 120.66 | 121.63 |
| 29-Jan-17 | 40,677,503 | 118 | 115 | 115 |
| 28-Jan-17 | 23,347,508 | 116 | 113 | 114 |
| 27-Jan-17 | 20,562,944 | 122.35 | 121.6 | 121.95 |
| 26-Jan-17 | 26,337,576 | 122.44 | 121.6 | 121.94 |
| 25-Jan-17 | 32,586,673 | 122.1 | 120.28 | 121.88 |
| 24-Jan-17 | 23,211,038 | 120.1 | 119.5 | 119.97 |
| 23-Jan-17 | 22,050,218 | 120.81 | 119.77 | 120.08 |
| 22-Jan-17 | 40,677,503 | 117 | 114 | 114 |
| 21-Jan-17 | 23,347,508 | 111 | 113 | 112 |
| 20-Jan-17 | 32,597,892 | 120.45 | 119.73 | 120 |
| 19-Jan-17 | 25,597,291 | 120.09 | 119.37 | 119.78 |
| 18-Jan-17 | 23,712,961 | 120.5 | 119.71 | 119.99 |
| 17-Jan-17 | 34,439,843 | 120.24 | 118.22 | 120 |
To create this Stock chart, you need to arrange the data on your sheet in order of Volume, High price, Low price and Closing price.
Then select the data On theINSERT tab, in the Charts group, click the Stock, Surface or Radar chart icon on the Ribbon. In that select the Third stock chart (which is Volume-High-low-close-chart) as shown below
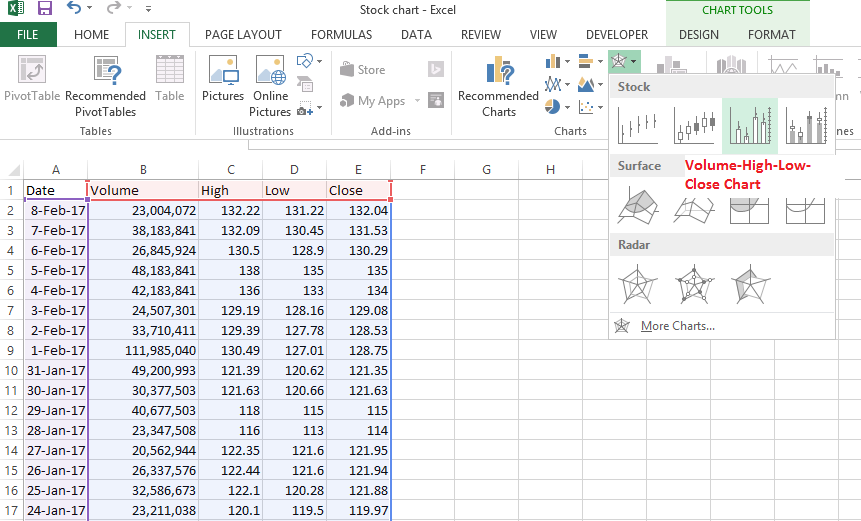
The resultant chart will be

Stock chart in Excel: 4. Volume-Open-High-Low-Close Chart
The Volume-Open-High-Low-Close Stock chart is often used to illustrate the stock prices along with volume. It requires five series of values in the following order- Volume, Open, High, Low, and then Close.
Data used for creation of this stock chart in excel is shown below
| Date | Volume | Open | High | Low | Close |
|---|---|---|---|---|---|
| 8-Feb-17 | 23,004,072 | 131.35 | 132.22 | 131.22 | 132.04 |
| 7-Feb-17 | 38,183,841 | 130.54 | 132.09 | 130.45 | 131.53 |
| 6-Feb-17 | 26,845,924 | 129.13 | 130.5 | 128.9 | 130.29 |
| 5-Feb-17 | 48,183,841 | 134 | 138 | 135 | 135 |
| 4-Feb-17 | 42,183,841 | 132 | 136 | 133 | 134 |
| 3-Feb-17 | 24,507,301 | 128.31 | 129.19 | 128.16 | 129.08 |
| 2-Feb-17 | 33,710,411 | 127.98 | 129.39 | 127.78 | 128.53 |
| 1-Feb-17 | 111,985,040 | 127.03 | 130.49 | 127.01 | 128.75 |
| 31-Jan-17 | 49,200,993 | 121.15 | 121.39 | 120.62 | 121.35 |
| 30-Jan-17 | 30,377,503 | 120.93 | 121.63 | 120.66 | 121.63 |
| 29-Jan-17 | 40,677,503 | 114 | 118 | 115 | 115 |
| 28-Jan-17 | 23,347,508 | 112 | 116 | 113 | 114 |
| 27-Jan-17 | 20,562,944 | 122.14 | 122.35 | 121.6 | 121.95 |
| 26-Jan-17 | 26,337,576 | 121.67 | 122.44 | 121.6 | 121.94 |
| 25-Jan-17 | 32,586,673 | 120.42 | 122.1 | 120.28 | 121.88 |
| 24-Jan-17 | 23,211,038 | 119.55 | 120.1 | 119.5 | 119.97 |
| 23-Jan-17 | 22,050,218 | 120 | 120.81 | 119.77 | 120.08 |
| 22-Jan-17 | 40,677,503 | 114 | 117 | 114 | 114 |
| 21-Jan-17 | 23,347,508 | 122 | 111 | 113 | 112 |
| 20-Jan-17 | 32,597,892 | 120.45 | 120.45 | 119.73 | 120 |
| 19-Jan-17 | 25,597,291 | 119.4 | 120.09 | 119.37 | 119.78 |
| 18-Jan-17 | 23,712,961 | 120 | 120.5 | 119.71 | 119.99 |
| 17-Jan-17 | 34,439,843 | 118.34 | 120.24 | 118.22 | 120 |
To create this Stock chart, you need to arrange the data on your sheet in order of Volume, Open Price, High price, Low price and Closing price.
Then select the data On theINSERT tab, in the Charts group, click the Stock, Surface or Radar chart icon on the Ribbon. In that select the fourth stock chart (which is Volume-Open-High-low-close-chart) as shown below
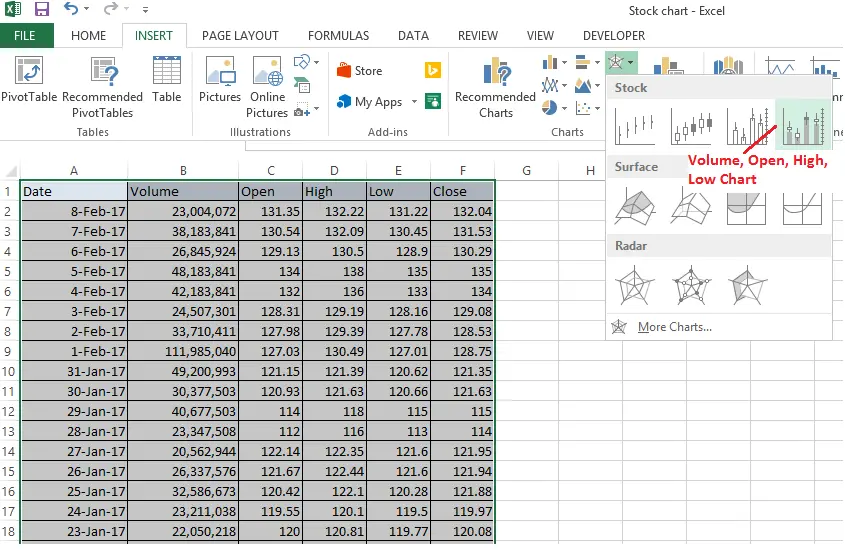
The resultant chart will be

so we have successfully created four different types of stock chart in excel
![]()
![]()
How To Create A Candlestick Chart In Excel
Source: https://www.datasciencemadesimple.com/stock-chart-in-excel/
Posted by: fostersagoonger.blogspot.com
0 Response to "How To Create A Candlestick Chart In Excel"
Post a Comment